The heating of buildings takes a big bite out of total energy consumption in Europe. In 2002, the European Commission therefore drafted a directive requiring member states to improve the energy efficiency of buildings (Energy Performance of Buildings Directive, or EPBD). This is done partly by introducing energy labels for existing homes, and partly by imposing increasingly stringent standards for new builds and for renovations of existing homes.
From 2021, only “near-zero energy” homes may be built, in which the little energy needed for heating, ventilation, cooling and hot water is obtained from renewable energy sources. The directive encourages a range of technological solutions, such as thermal insulation (of walls, floors and roofs), double, triple or quadruple glazing, efficient boilers or heat pumps, and mechanical ventilation systems.
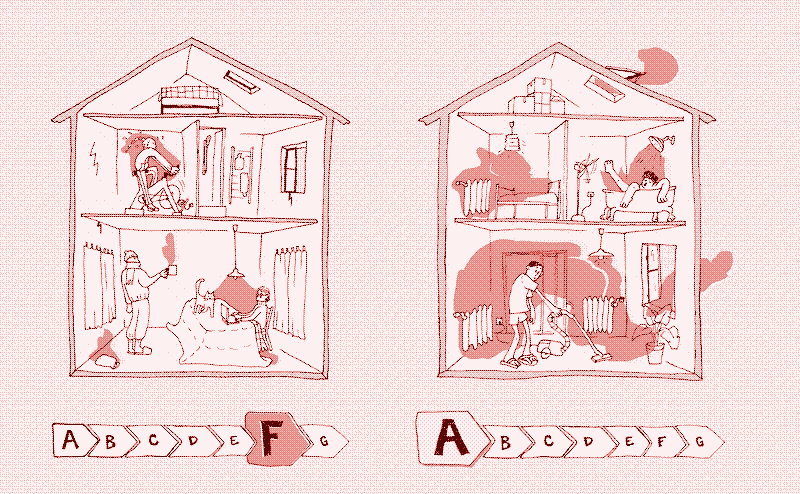
For example, in the Netherlands, the certification of existing houses was established by the Decree and Regulation “Energieprestatie Gebouwen” (BEG & REG). Houses are divided from class A (very economical) to class G (very inefficient), a system inspired by the energy labelling of appliances. The measure of energy efficiency for new homes and conversions is regulated by the “Energie Prestatie Coëfficient” (EPC), which culminates in “near-energy-neutral” homes in 2021.
To simplify, in the rest of the article we lump all these three-letter words together and call them “energy labels”. All regulations and decisions on the energy efficiency of homes – both inside and outside the EU – boil down to encouraging or mandating thermal insulation and efficient heating systems.
Theoretical versus actual energy consumption
An energy label indicates how energy-efficient an existing home is, or how energy-efficient a new home will be. The evaluation of a home or building plan is carried out by an energy expert and results in a theoretical energy consumption. The potential energy savings of thermal renovations or low-energy new construction, as well as the payback period of the investments, are based on this theoretical energy consumption.
However, research in several European countries has shown that the actual energy consumption differs greatly from the theoretical energy consumption. Although different calculation methods are used, the results of the studies are strikingly similar.
Germany
A study of 3,400 German homes – representative of the entire housing stock – concluded that the average measured consumption for all homes combined was 30% lower than the estimated energy consumption: 150 kWh/m2/year instead of the calculated 225 kWh/m2/year. 1 Furthermore, the difference between actual and calculated energy consumption increases the less efficient the dwelling is. For homes with estimated energy consumption of 150 and 300 kWh/m2/year, actual energy consumption is 17% and 40% lower than calculated consumption, respectively.
For the least efficient houses (>500 kWh/m2/year), the actual consumption is on average 60% lower than the theoretical consumption. However, on the other hand, in houses with an energy label A (75 kWh/m2/year), the actual consumption is on average 30% higher than the estimated consumption. All in all, there is relatively little difference in average, measured energy consumption between German homes with very different energy labels: it fluctuates between 100 and 200 kWh/m2/year.
At the same time, there are also large differences – up to 600% – in actual energy consumption between individual houses with the same energy label. The study makes a comparison per square metre of floor space, so this difference is not caused by the size of the house. 1
Netherlands & Belgium
A number of Dutch studies reached similar conclusions. A study of 4,700 homes – respresentative of the entire housing stock – found that measured consumption for all homes combined was on average 30% lower than predicted consumption. For each individual dwelling, actual energy consumption could be up to 75% higher or lower. 2 More recent Dutch studies based on a much larger database of homes give almost identically the same results as the German study: in the most inefficient Dutch homes, up to 50% less is consumed than predicted, while in the most efficient homes up to 25% more energy is consumed than predicted. 3
Finally, a study of 964 Belgian homes also produced very similar results, again using a different calculation method, as the scientists made a comparison based on the insulation value of the home. In the worst-insulated houses (U-value of 1.6W/m3K), the actual energy consumption is 45% lower than the predicted energy consumption, while in moderately insulated houses (0.6W/m3K) it is 25% lower. Then again, in the best-insulated houses (less than 0.15W/m3K), the measured energy consumption is 15% higher than the predicted energy consumption. 4
Calculation errors
Not all these results can be readily compared, partly because hot water is sometimes taken into account and sometimes not. But the conclusion is clear: the theoretical or predicted energy consumption in a home differs significantly from the actual energy consumption. Why is this?
A first explanation is wrong estimates of the energy efficiency of homes. The software used to calculate a home’s energy consumption may be inaccurate or poorly used. 5 In addition, the thermal efficiency of new technology or new materials is not always well established, and there is not always unanimity on the properties of both new and old building methods.
Some criteria are very debatable: for example, for the thermal insulation of the building envelope in an old building, estimates are often made based on the year of construction, which is little more than a guess. Recent research argues that the average insulation value of solid walls was underestimated for years. The authors conclude that based on their findings, millions of old buildings should in fact be given a better energy label. 6
Heat demand
A second explanation for the large difference between predicted and measured energy consumption is occupant behaviour. Energy consumption for heating depends not only on the energy efficiency of the house, but also on the heat demand.
In turn, heat demand is determined by the number of heating hours per year, the desired indoor temperature, the number of rooms heated, the interior of the building (floor coverings, curtains), heat production from appliances, clothes worn, physical activity, use of personal heating or insulation sources such as hot water bottles and blankets, and the weather. 7
With the exception of the weather, all these factors that determine heat demand are conveniently ignored or standardised when calculating theoretical energy consumption and assigning energy labels. This is problematic as the research results show that there is also a clear relationship between the efficiency of the house and the heat demand: the more inefficient the house, the bigger the difference becomes between the calculated and measured energy consumption.
Room temperature
Some standardised assumptions lead to obvious overestimates of heat demand. For example, mathematical models assume that the entire house has an indoor temperature of 18°C (65°F). However, research shows that many bedrooms are not or rarely heated, and the average temperature in reality is much lower. [4] Old homes that only have a local heating source in the living room (as it used to be the custom) cannot even technically heat the whole house to 18°C. 3
It is therefore to be expected that the more inefficient the house is, the lower the indoor temperature will be. The difference between predicted and actual energy consumption in Dutch houses with “energy label G” corresponds to a reduction of the indoor temperature in the entire house from 18 to 12.4°C (65° to 55°F).
On the other hand, in an efficient house with central heating, there is a chance that the indoor temperature will be higher than 18°C. For houses with “energy label A”, the difference between predicted and actual consumption in Dutch houses corresponds to an increase in the indoor temperature in the entire house from 18 to 20.7°C (65 to 70°F). 3
Incidentally, these results do not mean that many of these people cannot pay their energy bills. The homes surveyed are representative of the entire housing stock, and include affluent households that consume less energy than their energy label indicates.
Overestimating energy savings
According to policy, energy labels are not meant to measure actual energy consumption and serve only to compare homes. In that sense, energy labels can indeed be useful. The problem is that policy does rely on predicted energy consumption to calculate the savings potential and payback period of thermal renovations and new construction, and consequently comes out with questionable figures.
For example, let’s assume that a house with a predicted consumption of 500 kWh/m2/year consumes only 225 kWh/m2/year, in line with the study results. A major renovation makes this house more energy efficient, with a predicted energy use of 250 kWh/m2/year. According to the policy, 250 kWh/m2/year is then saved, but in reality the consumption is higher than before (250 versus 225 kWh/m2/year). If the energy consumption after the refurbishment is also lower than predicted (about 165 instead of 250 kWh/m2/year, in line with the survey results), even then the savings are considerably smaller than what the figures would lead us to believe (65 instead of 250 kWh/m2/year).
Looking at the entire housing stock in these studies, the actual energy consumption is 30% lower than the predicted energy consumption. From this, we can conclude that the savings from thermal renovations and efficient new construction are overestimated by about 30%. However, it’s worse that that, because we must also take into account the energy it costs to carry out thermal renovations or new construction: producing, transporting and installing thermal insulation, efficient heating appliances and triple glazing requires energy. That invested energy consumption should be subtracted from the energy savings.
In cases where actual energy consumption is much lower than calculated, as is the case in many inefficient homes, this can cause the energy efficiency to become negative: the supposedly efficient measures actually cost more energy than is saved over the lifetime of the technology. In renovation or new construction, frugal residents may therefore be forced to adopt unsustainable measures.
Underestimating economic payback times
Energy labels saddle homeowners with additional costs, whether for new construction or renovation. The European directive therefore states that investments should be able to be recovered in a reasonable period of time through lower energy bills. In short, energy labels promise a win-win situation: homeowners save money (in the long run) and energy consumption goes down. Moreover, owners have little other choice: non-compliance with the legislation attracts fines.
Unfortunately, the economic payback period is also based on predicted energy consumption. The higher the initial heat demand, the greater the energy savings and the shorter the payback period of an investment in energy-efficient technology. And vice versa, of course: if the heat demand is lower than predicted, the economic payback period of the investment becomes longer. Households that are thrifty with energy are thus forced into uneconomic investments.
The Dutch study of 4,700 homes shows that no single energy efficiency measure is economically viable for all households. The best results are for post-insulation of air cavities, energy-efficient heaters and insulated windows, whose investment is financially profitable for 61-69% of Dutch households. All other measures (mechanical ventilation, solar water heater, external wall insulation, roof insulation and floor insulation) are economically profitable for less than 30% of Dutch homes. 2
A similar conclusion applies to energy-efficient new buildings. Because in this case the actual energy consumption is usually higher than the predicted energy consumption, the additional investments in energy-efficient new construction do not bring the expected savings, and the economic and energy payback time is prolonged.
How to measure?
In short, high thermal standards and energy labels based on theoretical calculations do as much harm as good. The energy savings are a lot smaller than suggested, and a significant proportion of households are forced to make unprofitable and unsustainable investments. Moreover, the policy leaves heat demand untouched.
The solution may be that policies are based on actual energy consumption. This can be done in two ways. First, the results of these studies could be taken into account. For example, since actual consumption in homes with an energy use of 500 kWh/m2/year is on average 60% lower than predicted, potential energy savings could be calculated on that figure (215 kWh/m2/year). A similar correction is now made based on weather conditions.
The policy could also assess on a case-by-case basis. The information for this is available: the energy bill of the household in question. Thus, whether a household would be obliged to carry out thermal renovation could be determined simply by looking at its energy bills for the last few years. However, such a policy would be difficult to implement with new builds or when the composition of the household changes.
Either way, a policy that takes into account real energy consumption kills two birds with one stone. First, the energy savings and cost-effectiveness of thermal renovations and new construction would improve, as they would no longer be carried out for homes where they do not make sense. Second, this way, households would also be motivated to consume less energy – which is currently not happening in any way.
Reactions
To make a comment, please send an e-mail to solar (at) lowtechmagazine (dot) com. Your e-mail address is not used for other purposes, and will be deleted after the comment is published. If you don’t want your real name to be published, sign the e-mail with the name you want to appear.
Reactions
Keith
The article says, “….the actual energy consumption differs greatly from the real energy consumption.” I think it should read, “….the actual energy consumption differs greatly from the theoretical energy consumption.”
I really appreciate your magazine, by the way. Keep up the good work.
Kris De Decker
Thank you, Keith, I fixed it.
fritz
dear lowtechmagazine-team,
even though im quite late to the party i wanted to express my appreciation for the article on energy labels. i’m a young architect from germany and did my certification to be an “energieeffizienzexperte” about a year and half ago. consequently the more i understood and looked into the topic i had to realise how for most of the clients asking me about an energetic renovation of their home, it just doesn’t add up, neither financially nor ecologically when considering the required materials CO2 footprint. now i might just send your article for further information instead of doing all the explaining myself, it’s even available in german! unfortunately this knowledge doesn’t relieve one from but rather burdens with the certainty how much of our state funded support for sustainability isn’t actually much but another economic incentive for the producers of insulation materials etc.
i ordered your book, too and am looking forward to learning more. hopefully the modern human can move past green washing and strive for actual sustainability for which, here im pretty sure, the key isn’t more and new products, but actually consuming less but smarter!
keep up the great work,
fritz from frankfurt a.m.
Philipp
Hello there,
Firstly, very good article, again. Thanks for all the work you are doing. I try to buy all the books you offer as a way of supporting. When I initially found your blog some years ago I read the whole backlog and if ever I end up being president or primeminister of a country I shall have you lead my team of advisors. :D
On the article reg. Energy labels. I think there is a point you are underestimating in significance and should have been covered to give a comprehensive picture. It is competence of the people doing the assessments and competence of installers. In the UK it is often property phoyographers that offer the energy label service as part of them going into a home. That is a joke to start with.
Additionally, looking at our property. The old farmhouse that was retrofitted with internal insulation and loft insulation in the mid 90s is well below what one would expect. The quality of the installation of retrofit measures is do bad that they are nearly pointless. That includes contractors having fitted loft insulation close to access points only and not beyond the immediately visible spaces in the loft. However, our EPC says we have loft insulation theoughout. This is the third house we own and renovate in the UK…. Not a single one had reasonable quality in workmanship throughout.
Just something to consider. Deterioration of quality professionals across all trades will play a bit factor whenever theory and averages are concerned.
Thanks again for all your good work. If only we lived in a world as sensible as your blog. :)
Cheers Philipp